Aug 25, 2026
![How to Spot Churn Before Customers Cancel [2026]](/_next/image?url=https%3A%2F%2Fwedigtech-strapi-media.s3.ap-south-1.amazonaws.com%2Ffiles%2FWedigtech_Blog_Images_8c6af330e0.png&w=3840&q=75)
How to Spot Churn Before Customers Cancel [2026]
The Cancellation Was Decided Weeks Before It Arrived
A customer submitted a cancellation request on a Tuesday. The account manager was blindsided. The last quarterly review had been positive. The relationship felt fine.
It was not fine, and it had not been fine for two months. Logins had quietly dropped. The main champion had stopped opening product emails. Two power features had gone unused since a team reorganisation the customer never mentioned. Every signal was there in the data. Nobody was reading it.
By the time a B2B customer clicks cancel, they checked out weeks ago. The decision to leave shows up in behaviour long before it shows up in a cancellation form. The businesses that keep their customers are not better at saving deals at renewal. They are better at seeing the exit signals early enough to change the outcome.
What Late Detection Actually Costs
Product usage declines by an average of 41% in the quarter before cancellation, according to Focus Digital's voluntary churn analysis (2025), which means most churn comes with a 90-day warning window. Most B2B SaaS teams miss it. The average company monitors fewer than four product usage metrics despite having access to more than 40 actionable signals, according to Totango's State of Customer Success data (2025).
The cost of missing that window is not abstract. Losing one B2B customer often means months or years of revenue that cannot be quickly replaced. A company that reduces annual churn from 10% to 8% can see a 20%-plus revenue impact over three to five years through improved retention economics, according to Churn Buster (2026). Retention is not a customer-success line item. It is a growth lever.
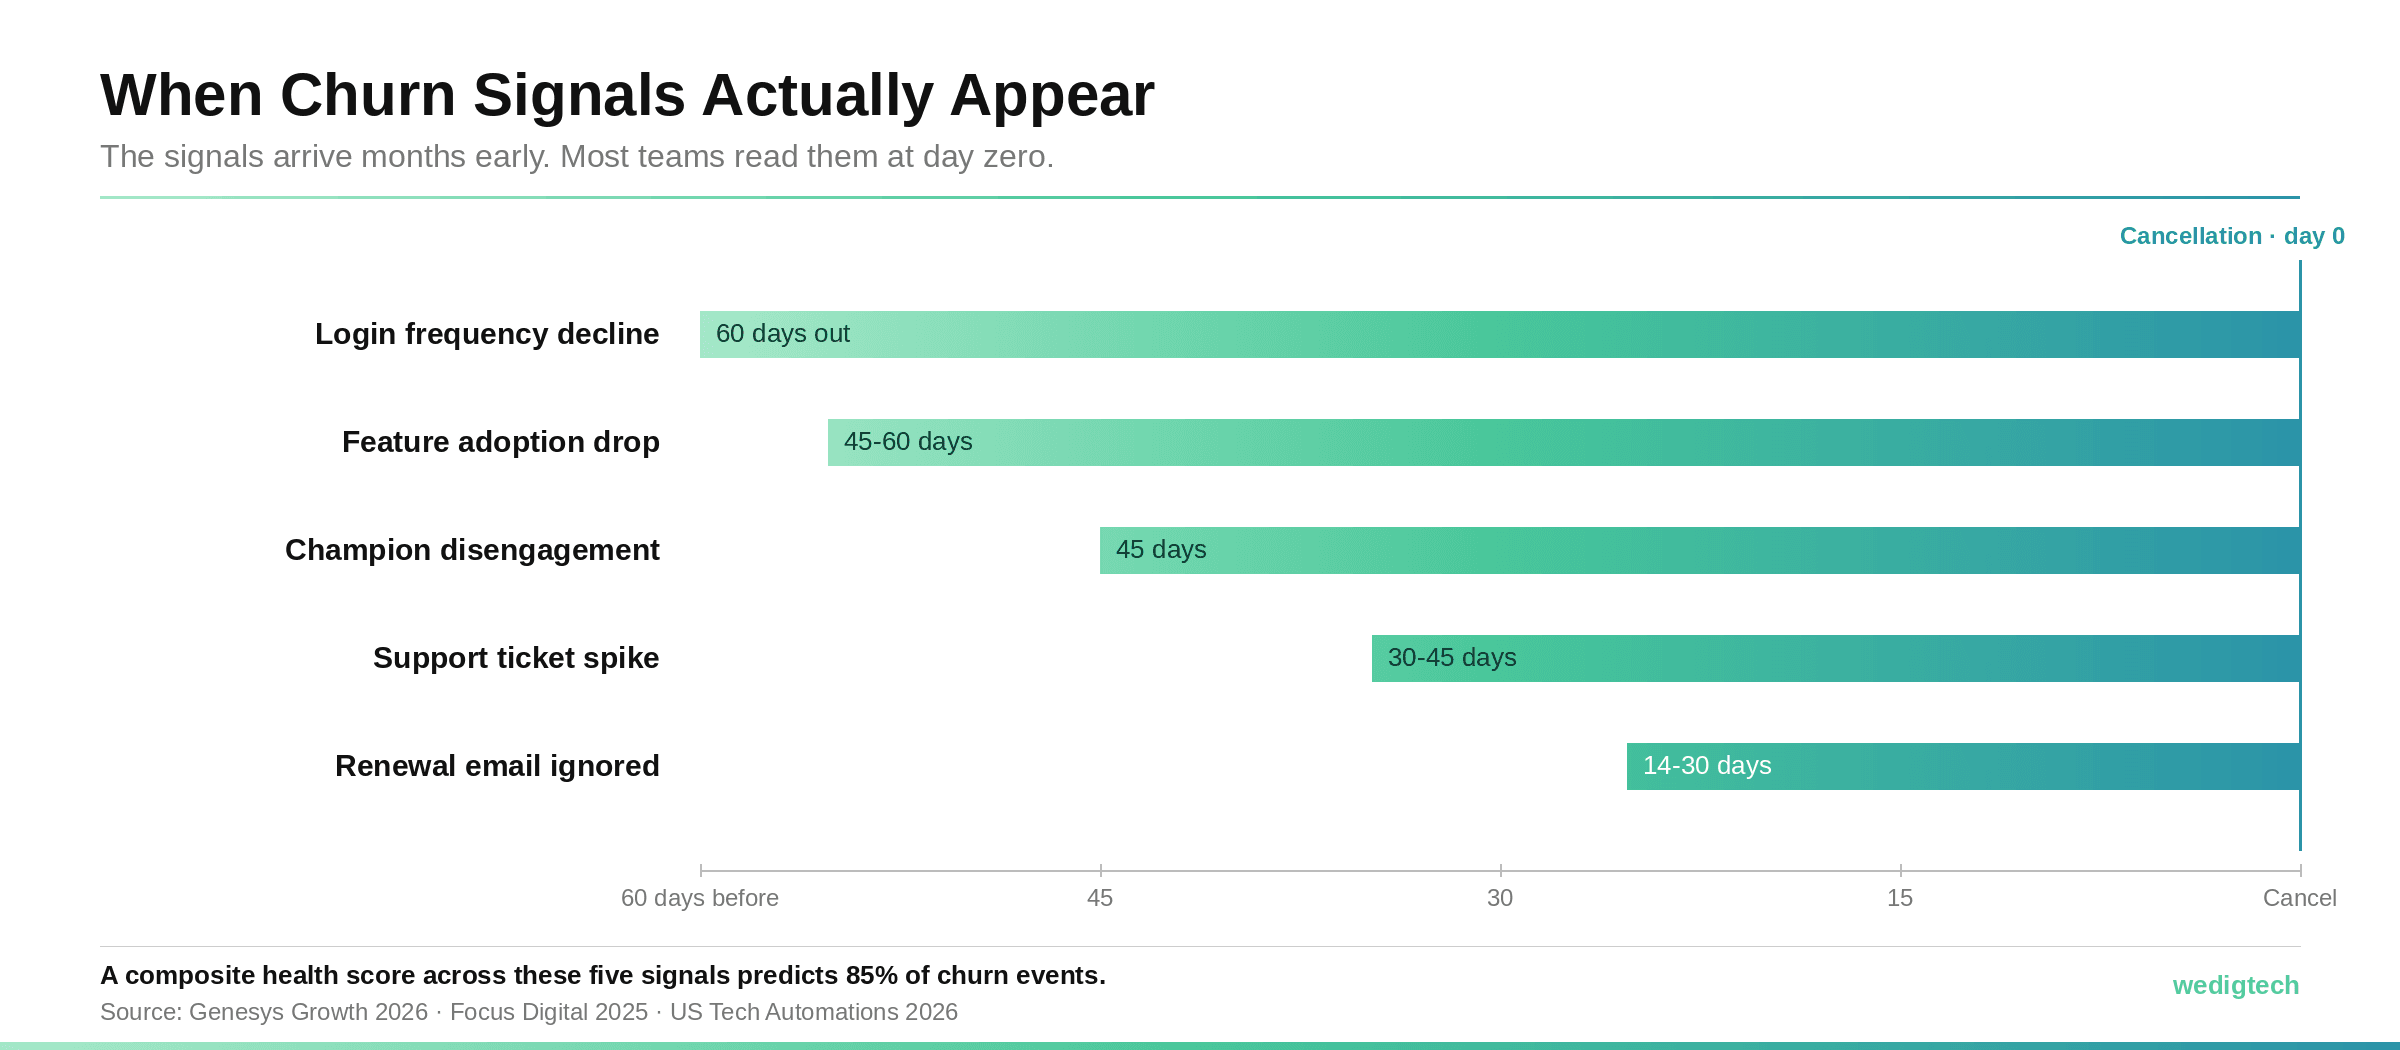
The signals arrive months early. Most teams read them at day zero.
The Early Churn Signal Scorecard
You do not need a data science team to predict churn. You need to watch the right five signals and score every account against them consistently. Here is the framework. Score each account on each signal, then band the total.
How to band the score
Assign each signal a 0 to 20 score, where 20 is healthy and 0 is the warning threshold or worse. Add the five together for a composite health score out of 100. Then band it.
Combining these signals in a health score model can predict 85% of churn events, according to Vitally (via Genesys Growth 2026). A spreadsheet version of this model gets you most of the way to what expensive platforms detect. The signals matter more than the software.
Where AI Turns a Scorecard Into a System
A manual scorecard works. It also has three limits: it is only as current as the last time someone updated it, it can only track the signals a human remembers to check, and it treats every account the same regardless of context. This is where AI behavioural scoring changes the outcome.
An AI layer does three things a spreadsheet cannot.
It reads every account continuously. Instead of a weekly manual review of your largest accounts, an AI layer scores every account in the base every day, so a mid-size account drifting toward churn is caught with the same rigour as a flagship one.
It catches signal combinations a human would never define. A single dropped signal is noise. A customer who has stopped using two features, reduced logins by 30%, and whose champion went quiet 45 days ago is a pattern. Companies combining quantitative product data with qualitative signals like support sentiment achieve 23% higher prediction accuracy than usage data alone, according to Forrester's 2025 Customer Intelligence Wave.
It buys time. B2B SaaS companies using automated usage monitoring detect at-risk accounts 45 days earlier than those relying on manual review, producing a 3.5x improvement in intervention success rates, according to Gainsight's 2025 platform benchmark data. The intervention itself matters less than how early it starts.
The results compound. Gartner's 2025 Customer Success Benchmark found B2B SaaS companies using AI-driven churn prediction see average net revenue retention improvements of 8 to 12 percentage points. At the valuation multiples B2B SaaS trades on, that swing is often the difference between a flat round and a strong one.
What Early Detection Looks Like in Practice
A $22M ARR HR technology company built an automated relationship health system that detected champion departures 45 days before cancellation. In its first year, the system preserved $1.8M in ARR that would otherwise have churned, according to results reported at Totango's 2025 customer summit. The company reached payback on the investment within 90 days.
The mechanism was not a better save offer at renewal. It was seeing the champion go quiet six weeks before anyone would have noticed manually, and acting while the relationship could still be rebuilt. The signal was always there. The system made it visible in time to matter.
From Scattered Signals to a Retention System
Most B2B SaaS businesses have the churn signals sitting in their product database, their support tool, and their CRM. What they lack is the system that connects those signals, scores every account continuously, and puts a clear action in front of the right person at the right time.
Wedigtech's Customer System is built to design and operate exactly that. It connects the behavioural data you already generate, adds an AI scoring layer that reads every account daily, and installs the intervention workflow that turns a red flag into a saved customer. Because Wedigtech takes equity in the outcome, the retention system is built to keep compounding after Month 6, not to be handed over and forgotten.
Was this helpful?
Ready to architect your next stage of growth?
Partner with wedigtech and turn ambition into compounding, measurable outcomes.
More from Insights
View All

The Founder's Figma Playbook: Design and Test Your Product Before You Build
A practical playbook for how founders use Figma to design great products: the exact workflow, how to use Figma Make and Dev Mode, and how to test your product before you write a line of code.
Read More
ClickUp Brain AI for Founders: 10 Use Cases, the AI Notetaker, and Why It Replaces Your Whole Stack
How ClickUp Brain AI helps founders and enterprises: the project-visibility problem it solves, 10 real use cases of Brain AI, exactly how to use the AI Notetaker, and why ClickUp replaces multiple tools.
Read More
How to Build an AI-Powered Shopify Store App (Step-by-Step, 2026)
A step-by-step guide to building an AI-powered Shopify store app: the AI features to include, the Shopify + AI tech stack, the exact build plan, and how to launch.
Read More